I live underneath a flight path, and I’m always wondering what plane is flying overhead. I looked up online, and the only device that was well referenced was the flight wall. Unfortunately, can’t buy it in Australia.
So I decided to build my own from scratch. What started as a quick weekend hack turned into a five-part system: a web app, a cloud proxy, two standalone ESP32 displays with touchscreens, and a Raspberry Pi dashboard. No API keys anywhere, no build step, no dependencies. The whole thing is MIT licensed and running live at overheadtracker.com.
Architecture
The project has five components that work together but can each function independently:
The web app is a single index.html file, 2,500 lines of vanilla JavaScript with Leaflet for the map. You can clone the repo and open the file directly in a browser. It deploys to GitHub Pages on every push.
The proxy server is a Node.js/Express server hosted on Railway at api.overheadtracker.com. It exists for three reasons: cache upstream API responses so multiple clients don’t hammer free services, enrich flight data with route information the raw APIs don’t provide, and give the ESP32s a single HTTP endpoint instead of dealing with HTTPS certificate validation on a microcontroller.
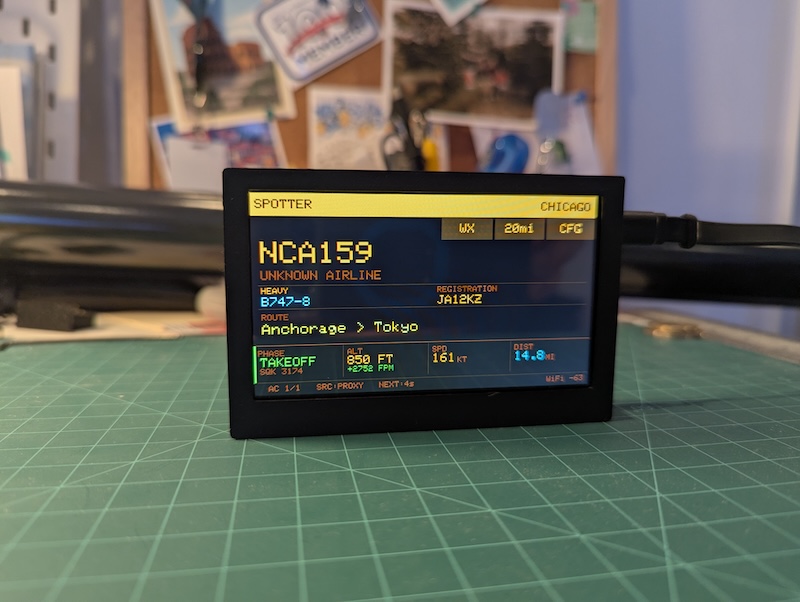
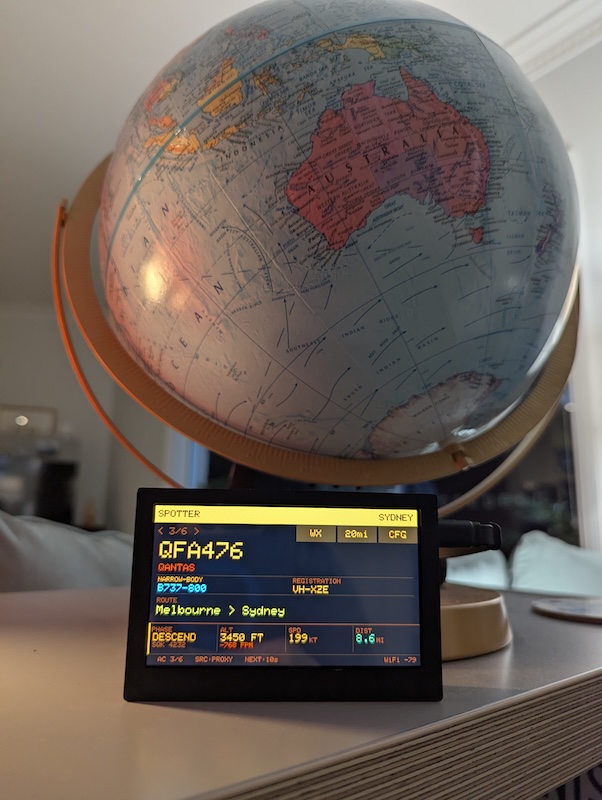
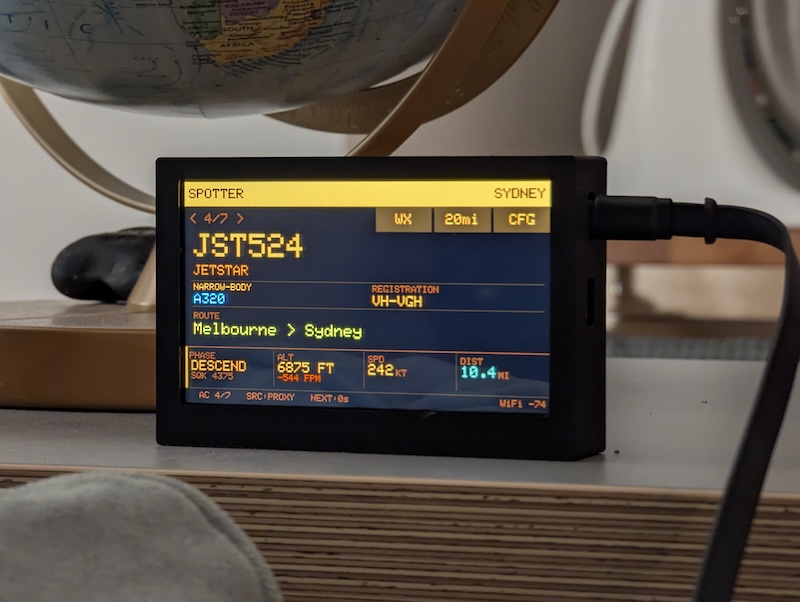
Echo, the first hardware display, is a Freenove FNK0103S — an ESP32 with a 4” 480x320 SPI touchscreen. It sits on a shelf and cycles through overhead flights every 8 seconds.
Foxtrot is the second-generation display: a Waveshare ESP32-S3-Touch-LCD-4.3B with an 800x480 IPS screen, capacitive touch, and 8 MB of PSRAM. Bigger screen, smoother rendering, and a whole set of hardware challenges that earned its own post.
The Pi display is a Raspberry Pi 3B+ driving a 3.5” TFT, running a Python/Pygame dashboard that auto-rotates between three pages: a flights page showing the two closest aircraft, a stats page with proxy health and a 24-hour traffic histogram, and a server status page showing connected device health cards.
Finding the right APIs
The first problem was getting live aircraft positions. Commercial services like FlightRadar24 charge for API access, but there’s a whole ecosystem of community-run ADS-B feeders that aggregate data from volunteers with RTL-SDR receivers. I found three that offer free, keyless JSON APIs:
ADS-B flight data
All three services, adsb.lol, adsb.fi, and airplanes.live — accept a simple point query: give them a latitude, longitude, and radius in nautical miles, and they return every aircraft in that circle. The response is a JSON array where each aircraft has a hex identifier, callsign, altitude, ground speed, vertical rate, heading, squawk code, and ICAO aircraft type code.
Since these are volunteer-run, any one might go down at any time. Instead of racing all three in parallel (which wastes two API calls per request), the proxy tries them sequentially in round-robin order — one call per cache miss instead of three:
const apis = [
  { name: 'adsb.lol',       url: `https://api.adsb.lol/v2/point/${lat}/${lon}/${radius}` },
  { name: 'adsb.fi',        url: `https://opendata.adsb.fi/api/v3/lat/${lat}/lon/${lon}/dist/${radius}` },
  { name: 'airplanes.live', url: `https://api.airplanes.live/v2/point/${lat}/${lon}/${radius}` },
];

// Try APIs sequentially (round-robin) — 1 call per cache miss instead of 3
const startIdx = apiRoundRobin % apis.length;
for (let attempt = 0; attempt < apis.length; attempt++) {
  const api = apis[(startIdx + attempt) % apis.length];
  try {
    const r = await fetch(api.url, { signal: AbortSignal.timeout(2500) });
    if (r.status === 429) { cooldown(api); continue; }
    if (!r.ok) continue;
    data = await r.json();
    break;
  } catch { continue; }
}
apiRoundRobin++;
The round-robin counter rotates which API is tried first, spreading load evenly across all three services. If one fails or returns a 429 rate-limit, it gets a 60-second cooldown and the next API in the rotation is tried immediately. The web app has its own fallback chain too — it tries the proxy first (6-second timeout), then falls back to hitting the APIs directly.
Route and airline lookup
ADS-B data gives you a callsign like QFA1 and a hex code, but not where the flight is going. To get departure and arrival airports, the proxy queries adsbdb.com — a community-run database that returns origin/destination airports for a given callsign. On the first time the proxy sees a new callsign, it blocks for up to 3 seconds to fetch the route from adsbdb before responding. This eliminates the “NO ROUTE DATA” problem where flights would appear without route information on first sight.
Routes are cached with a 30-minute TTL (LRU-evicted at 5,000 entries). A flight’s route doesn’t change mid-air, so there’s no point re-fetching it every 15 seconds.
Airline names come from the ICAO callsign prefix — QFA maps to Qantas, CPA to Cathay Pacific, UAE to Emirates. The lookup table covers 46 airlines, each colour-coded by one of eight brand colours: Qantas red, Cathay green, Emirates gold, and so on. Aircraft type codes get translated too — B789 becomes B787-9 Dreamliner, A20N becomes A320neo. The airport database covers nearly 600 airports worldwide after expanding for international deployments.
Everything else
The remaining APIs are straightforward: Nominatim (OpenStreetMap) for geocoding locations, Planespotters.net for aircraft photos by registration, Open-Meteo for weather data, and CartoDB for dark map tiles. Every single one is free and keyless. The only API key in the project is for Resend, used to send daily flight reports and route discovery emails.
Flight phase detection
Each aircraft’s flight phase is derived purely from its altitude and vertical rate — no external data needed. The logic is a simple decision tree:
function flightPhase(f) {
  const alt  = f.alt_baro;
  const vspd = f.baro_rate || 0;

  if (alt < 3000) {
    if (vspd < -200) return 'LANDING';
    if (vspd >  200) return 'TAKING OFF';
    if (vspd <  -50) return 'APPROACH';
  }
  if (vspd < -100) return 'DESCENDING';
  if (vspd >  100) return 'CLIMBING';
  return 'OVERHEAD';
}
The ESP32 firmware uses the same logic but adds two extra states: CRUISING as the default instead of OVERHEAD, and a dedicated OVERHEAD that triggers when the aircraft is within 2 km and below 8,000 ft. This distinction matters on a passive display that cycles through flights automatically, you want to know which plane is actually directly above you versus one that’s just high up and level.
Each phase gets a distinct colour in the UI. On the web app, the flight info block’s left border glows with the phase colour, red for landing, green for takeoff, amber for approach. On the ESP32, the phase column in the dashboard lights up the same way.
Making it resilient
Request deduplication
When 10 ESP32 devices and the web app all poll at the same time, only one upstream request should fire. The proxy uses an inFlight Map, the first request for a given coordinate set creates a Promise and stores it. Every subsequent request for the same coordinates awaits the same Promise:
const inFlight = new Map();

if (!inFlight.has(key)) {
  const promise = (async () => {
    // ... fetch from upstream, cache result
  })();
  inFlight.set(key, promise);
  promise.finally(() => inFlight.delete(key));
}
return await inFlight.get(key);
No thundering herd, no wasted API calls.
Caching and stale fallback
The proxy caches at three tiers: ADS-B data for 15 seconds, weather for 10 minutes, routes for 30 minutes. The key design decision: if an upstream API fails but stale cache exists, serve it. Flight data from 30 seconds ago is far better than an error. The response stays useful even if it’s slightly out of date.
ESP32 fallback cascade
Both firmware variants have a 3-tier fallback: Railway proxy over the internet, direct HTTPS to airplanes.live, SD card cache file. If the proxy is unreachable, the TCP connect timeout is 3 seconds — fast enough that the device boots cleanly even when the proxy is down, with no crash loop. After 3 consecutive proxy failures, the firmware skips the proxy entirely for 5 minutes and goes straight to the direct API. Direct API calls are only attempted if free heap is above 40 KB to avoid out-of-memory crashes from the larger HTTPS overhead.
Memory on a microcontroller
The ESP32 has limited heap, and repeated malloc/free calls fragment it over hours of continuous operation. The firmware allocates a single 16 KB JSON document at startup and reuses it every refresh cycle. That eliminates heap fragmentation and mysterious crashes after running overnight.
The web app
The web app is the primary interface, a single index.html that runs in any browser. Here’s what it looks like tracking flights out of Sydney:
![]()
At the top, a search bar takes any location (geocoded via Nominatim) and two sliders control the geofence radius and altitude floor, useful for filtering out high-altitude overflights or ground vehicles. Below that, the flight info card shows everything enriched by the proxy: callsign, registration, aircraft type with weight class, airline name, colour-coded flight phase, and full route.
The app now predicts intercept geometry — each aircraft is tagged as INBOUND, CROSSING, DIRECTLY OVERHEAD, or RECEDING based on its heading relative to your position, with an estimated time shown for inbound and crossing flights. Flight badges flag interesting aircraft: military, private/charter, bizjet, high speed (>520 kt), very high altitude (>43,000 ft), and anonymous (no callsign).
The six-cell data readout underneath displays raw ADS-B telemetry — altitude (QNH-corrected), ground speed, vertical speed, ground track, distance from your location, and squawk code. A weather strip shows local conditions from Open-Meteo (temperature, humidity, wind, UV). Below that, a Leaflet map on dark CartoDB tiles draws the geofence circle and plots the aircraft’s position relative to the tracked location.
When a registration is available, the app pulls an aircraft photo from Planespotters.net and displays it with photographer credit. The nav bar at the bottom lets you cycle through aircraft with PREV/NEXT, jump to the closest with NEAREST, toggle audio flight announcements with SND, or generate a shareable link. A session log tracks every aircraft seen since page load, with aggregate statistics: total seen, busiest airline, most common type, highest altitude, fastest speed, and closest approach.
The whole thing supports metric and imperial units, a light/dark mode toggle, and keyboard navigation for accessibility. You can share any location as a URL parameter, and there’s a demo mode (?demo=true) with seven scenarios — busy airport, quiet suburb, emergency squawk, and more — so people can try it without being near an airport.
The ESP32 displays
Echo — the 4” display
The first hardware build uses a Freenove FNK0103S, an ESP32 with a 4” 480x320 SPI touchscreen. Three touch buttons sit in the nav bar: WX shows the weather screen, GEO cycles through geofence radii (5 / 10 / 20 km), and CFG launches a captive portal where you configure WiFi credentials and location.
![]()
After the first USB flash, OTA updates work over WiFi — the device advertises itself as overhead-tracker.local via mDNS. Run ./build.sh ota and the TFT shows a green progress bar during the upload.
![]()
The weather screen pulls local conditions from Open-Meteo through the proxy — temperature, humidity, wind speed and direction. When there are no planes overhead, there’s still something useful on the display.
Foxtrot — the 4.3” display
The second-generation display uses a Waveshare ESP32-S3-Touch-LCD-4.3B — an 800x480 IPS screen with capacitive touch and 8 MB of PSRAM. The larger screen fits a four-column dashboard (phase, altitude + vertical rate, speed, distance) alongside the flight card, and the capacitive touch is a big upgrade over the resistive panel on Echo. I wrote a dedicated post about building Foxtrot — it turned out to be a much more interesting hardware journey than I expected.
Emergency squawk codes get special treatment on both displays: 7700 (MAYDAY), 7600 (NORDO), and 7500 (HIJACK) trigger a flashing red banner across the screen. The layout compacts automatically to fit the alert without clipping the flight data.
The proxy server
The proxy started on a Raspberry Pi 3B+ with PM2 and a Cloudflare Tunnel, but I migrated it to Railway. No more undervoltage issues, no more SD card corruption scares, and deploys are a single command. It runs at api.overheadtracker.com with rate limiting (100 requests/min per IP) and a concurrency semaphore capping upstream API calls at 20 simultaneous requests.
The caching strategy uses coordinate bucketing — nearby clients within the same geographic bucket share cached responses, so ten devices in the same house don’t trigger ten upstream fetches. Flight data is cached for 15 seconds, routes for 30 minutes, weather for 10 minutes. APIs that fail get a 60-second cooldown before they’re retried, and the system rotates through APIs round-robin to spread load.
Recent additions
Since the initial build, the project has grown a few operational features:
Route discovery tracking. The proxy tracks every unique route it sees in a known-routes.json file (capped at 20,000 entries). At 21:00 AEST each night, it sends a discovery email via the Resend API listing any new routes spotted that day. A daily backfill service runs at 02:00 AEST, enriching any flights from the previous day that were missing route data.
Device heartbeat. Both Echo and Foxtrot now POST a heartbeat to the proxy every 60 seconds, reporting firmware version, free heap memory, WiFi RSSI, and uptime. The proxy stores the latest heartbeat for each device and exposes it on the status dashboard.
Pi display server status page. The Pi display gained a third auto-rotating page that shows server system stats alongside health cards for each connected device, pulling from the heartbeat data.
Interactive architecture diagram. An architecture.html page built with Cytoscape.js visualises all 27 system components and their connections in a CRT amber aesthetic — draggable nodes, click-to-highlight, and tooltips on hover.
Try it
overheadtracker.com, or clone the repo and open index.html directly. Everything is MIT licensed.
Hope you enjoy it!